Compare two selected periods with the Store Analysis Report. Analyze revenue, expenses, orders, customers, collections, and operations on a single screen.
Seeing only the current state of your business is often not enough. What really matters is being able to compare results from a selected period with previous periods and clearly understand the change. The Store Analysis Report in Aktif Müşteri allows you to evaluate your store performance by comparing two selected periods side by side.
For example, you can compare March 2026 with March 2025 and review many critical metrics such as revenue, expenses, order volume, customer activity, collection performance, and operational intensity on a single screen. This helps you go beyond the numbers and better understand the actual changes in your business.
The Store Analysis Report is a comprehensive reporting screen that presents the selected period and the comparison period together. Its purpose is not only to show total values, but also to reveal how those values have changed compared to the previous period.
With this structure, business owners and managers can more easily answer questions such as: “Did revenue increase, how did order volume change, did customer acquisition improve, is collection performance stronger, and are expenses under control?”
One of the strongest aspects of the report is the ability to evaluate two different periods side by side. For example, you can compare the current month with the same month of the previous year and interpret seasonal changes more accurately.
Instead of looking only at total revenue, you can clearly see in which areas growth or decline occurred. Order volume may have increased while average order value decreased, or customer count may have grown while collection time became longer. The Store Analysis Report makes these details visible.
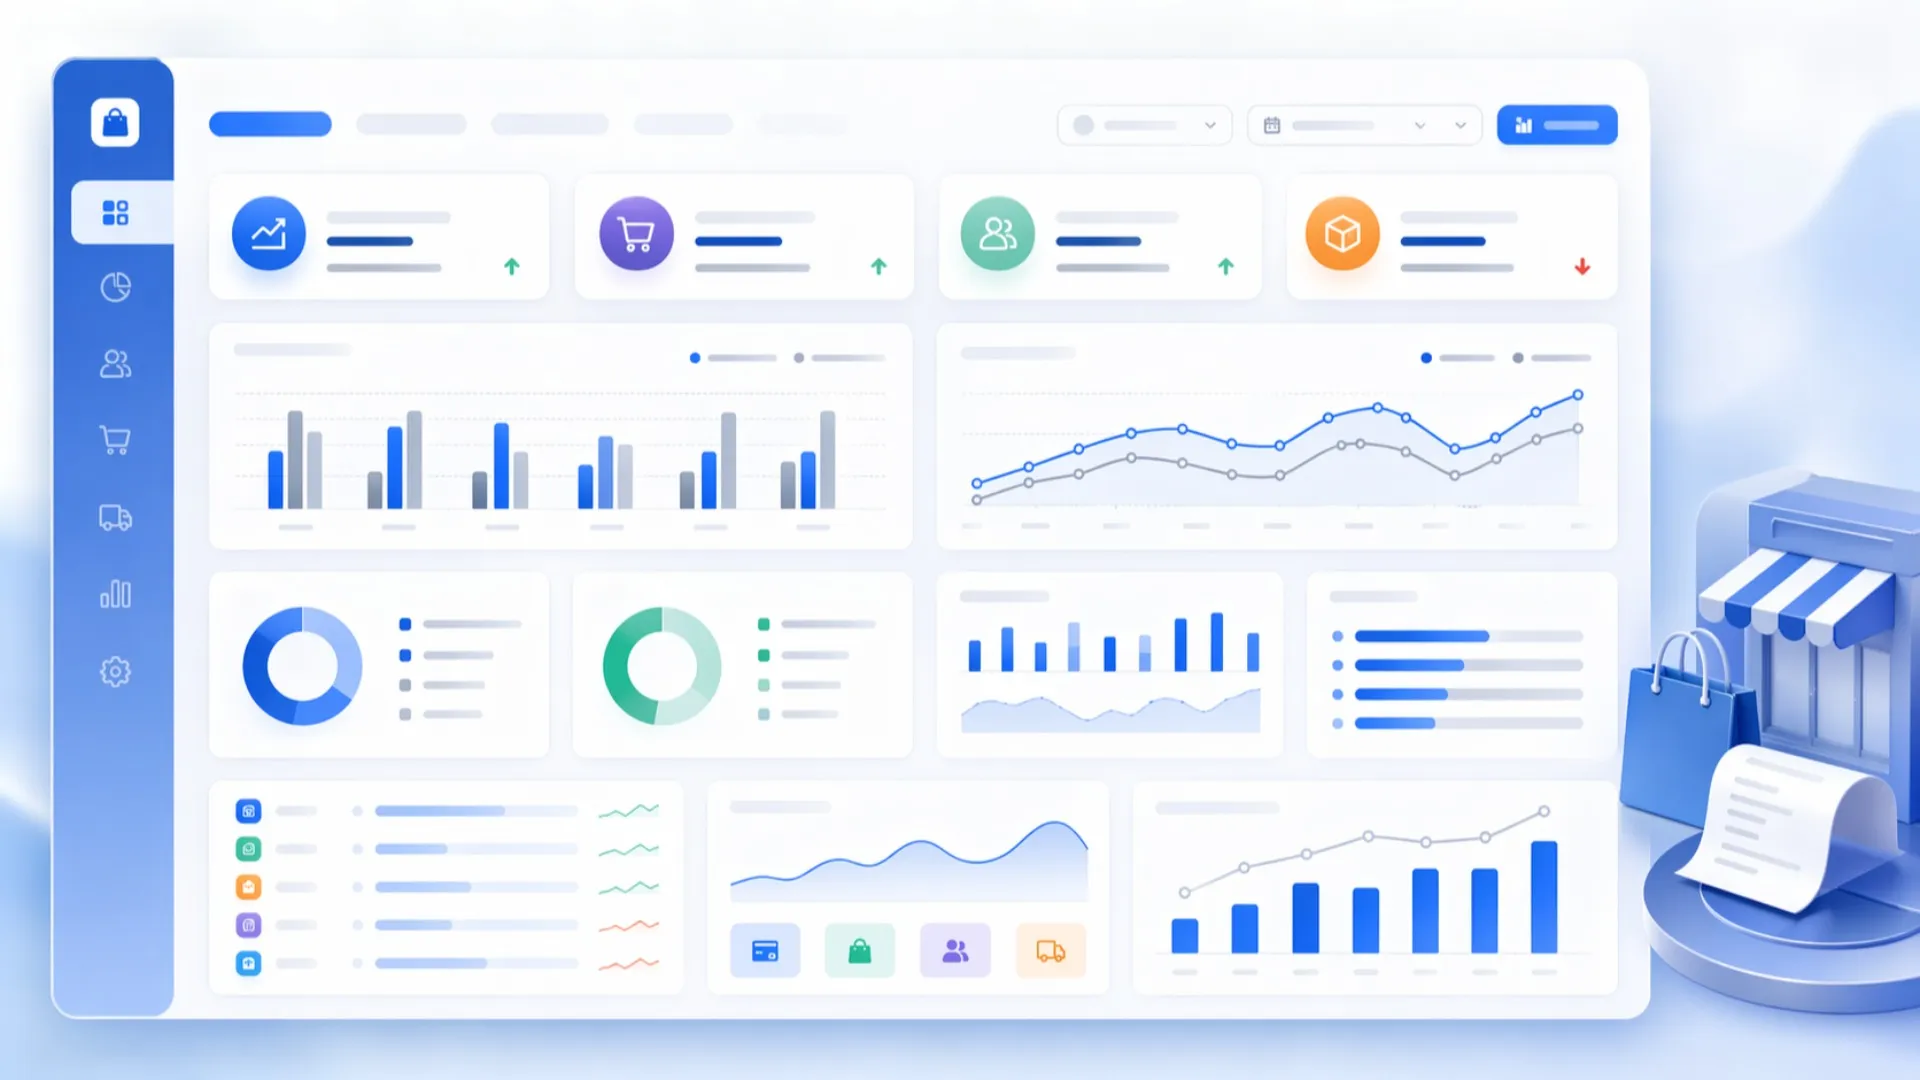
The General Overview tab helps you quickly understand the overall performance of your store. This section includes core indicators such as total revenue, total expenses, order count, product quantity, average order value, active customer count, new customer count, collection rate, and average collection time.
In addition to current values, the report also shows change rates compared to the previous period. This makes it possible to identify areas of improvement and decline at first glance.
Daily revenue and daily order comparison charts also make it easier to see how activity is distributed across the selected period. These charts help visualize busy days and highlight differences between two time periods more clearly.
The Customer Analysis tab is highly useful for evaluating customer activity. It presents metrics such as new customer rate, returning customer rate, lost customer rate, active customer count, and related customer totals in a comparative format.
This allows you to evaluate not only how many customers you had, but also the quality of customer movement. New customer acquisition may have increased, but if the returning customer rate declined, that may indicate a customer loyalty issue. Likewise, an increase in the lost customer rate may show the need for stronger re-engagement actions.
The Collection Analysis tab includes financial indicators such as total collections, collection rate, average collection time, outstanding receivables ratio, and total outstanding receivables. Payment types such as credit card, bank transfer, and others can also be reviewed separately.
This section helps you evaluate not only sales performance, but also how efficiently your collections are managed. Revenue may have increased, but if collection time has become longer or outstanding receivables have grown, this can affect the cash flow of your business. That is why collection analysis is an essential part of store performance evaluation.
The Expense Analysis tab helps you examine your store’s cost structure in greater detail. It provides summary information such as total expenses, expense-to-revenue ratio, highest expense category, most increased expense type, and most decreased expense type.
In addition, category-based and expense-type-based tables allow you to compare the previous period with the current one. This makes it easier to see changes in accounting, marketing, office expenses, personnel costs, and other operational expense items.
This view is especially valuable for keeping expenses under control and understanding the reasons behind cost increases.
The Operations Analysis tab provides important insights into the daily workflow of the store. It includes metrics such as order and revenue intensity by day of the week, highest revenue day, lowest revenue day, busiest order day, quietest order day, average delivery time, pending orders, and delayed orders.
It also includes charts for order creation hours and delivery hour intensity, helping you better understand your operational rhythm. By identifying which days and times are the busiest, businesses can improve staff planning and operational efficiency.
The Main Service Type Analysis tab allows you to compare the performance of different service groups. You can see which service types are growing more strongly, which ones are declining, and which products or services contribute more to revenue.
This section is especially valuable for businesses that offer multiple service categories. It helps you look beyond total revenue and understand the structure behind that revenue. As a result, it becomes easier to decide which services should be strengthened, improved, or promoted more actively.
Looking at a single period is useful, but real management power comes from comparison. In many cases, the true meaning of growth or decline only becomes clear when compared with a previous period.
The Store Analysis Report makes this comparison easier by presenting everything on a single screen in a clear and understandable structure. Business owners do not only see the results, but also understand in which areas those results were formed.
The Store Analysis Report is ideal for business owners, managers, and decision-makers who want to monitor store performance regularly. It is especially useful for businesses that want to compare different periods, track growth trends, evaluate customer and collection performance, strengthen expense control, and understand operational intensity more clearly.
The Store Analysis Report helps you evaluate your business performance not only through raw numbers, but also through change and comparison. It brings together many essential categories such as revenue, expenses, orders, customers, collections, and operations in a single report.
If you want to see more clearly where your store is getting stronger, which areas require more attention, and how period-based changes affect your business, the Store Analysis Report can provide a much stronger perspective for decision-making.

Create a free demo account with Aktif Müşteri POS Software and try it for 15 days without any fees!