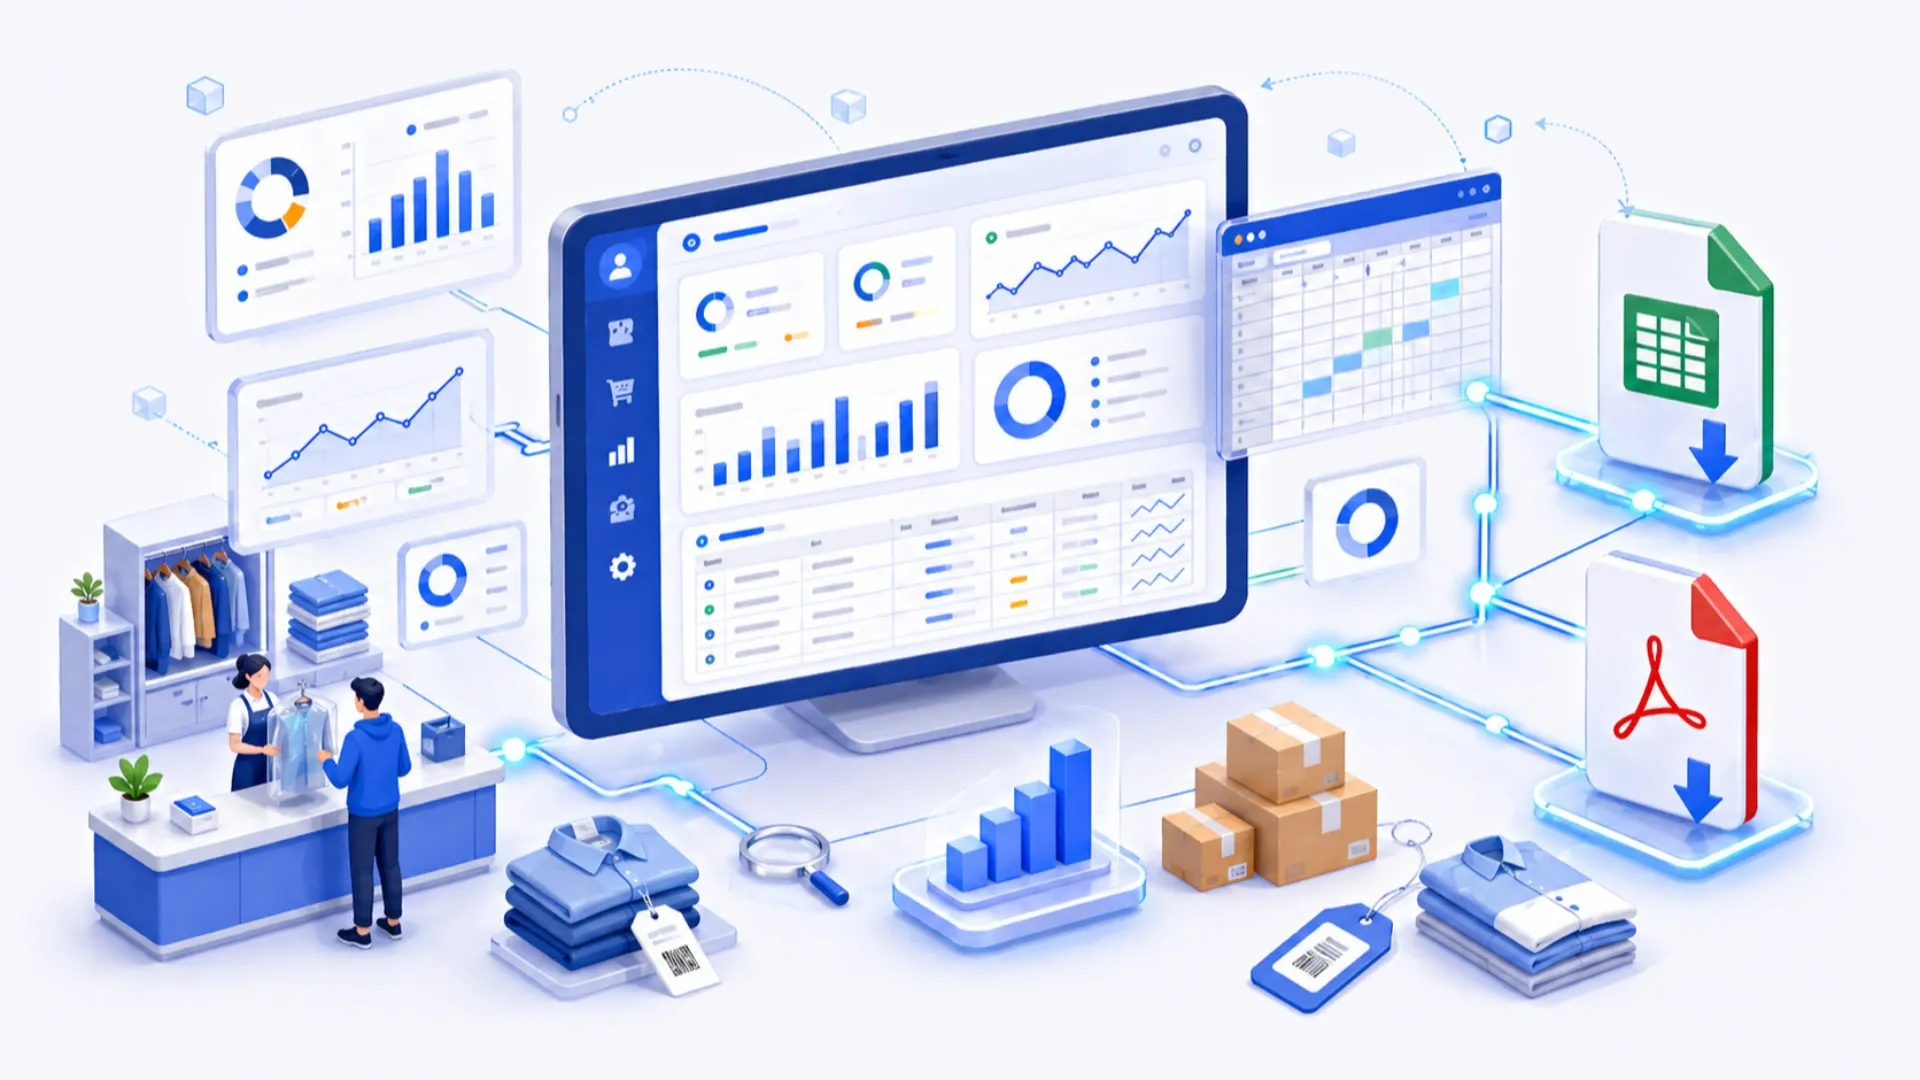
Sales, orders, branch, staff, and finance reports; filters/pivots, charts, alerts, and one-click export to Excel/PDF.
Detailed Reporting & Excel/PDF Exports
In service businesses such as dry cleaning, carpet washing, shoe care, tailoring, and car wash, accurate reporting directly impacts profitability, team efficiency, and customer satisfaction. At the end of the day, seeing only the “total revenue” isn’t enough; you need to clearly know which branch experienced peaks in which time slots, which services increased basket size, which campaigns delivered returns, and which order steps caused delays. This page explains the system’s detailed reporting infrastructure and how to quickly turn data into action with one-click Excel/PDF exports.
Why Detailed Reporting?
- Data-driven decisions: Rely on trends and real-time measurements—not guesses.
- Operational visibility: Instantly spot bottlenecks across pickup → processing → ready → delivery stages.
- Profitability uplift: Service profitability, campaign ROI, and branch performance become clear.
- Transparent team tracking: Staff KPIs measured by speed, quality, and return rates.
- End-to-end finance: POS/cash register and online payments (PayTR/iyzico) reconcile with invoicing.
Report Coverage: Every Dimension of the Business
1) Sales & Revenue
- Day/Week/Month: Time-series tracking of revenue, basket size, order count, and profitability (with optional cost inputs).
- Channel breakdown: In-store, phone/call center, online orders; conversion and average ticket per channel.
- Payment type: Card, cash, payment link, prepaid package/bonus usage ratio.
- Returns/Cancellations: Reason codes, partial/full return totals; trends and cashier impact.
2) Orders & Operations
- Stage-based flow: Pickup → intake → processing (wash/iron/repair) → quality → packing → delivery.
- Durations: Average wait/cycle time at each stage; SLA compliance and alert thresholds.
- Labels & traceability: Station transitions via barcode/QR; lost/missing item alarms.
3) Branch & Region Performance
- Branch comparison: Revenue, orders, basket size, returns; peak hours and resource planning.
- Regional view: Demand curves and slot occupancy rates in courier/pick-up zones.
4) Finance & AR
- Collections: Consolidated view of POS/cash register (Ödeal, Hugin, Pavo; SmartOne/Omnitech in AZ) and online payments (PayTR, iyzico).
- Accounts receivable: Customer-level debit/credit, overdue lists, and reminder history.
- e-Document status: Reports for e-Invoice/e-Archive creation, responses, and cancellations.
5) Campaigns & Loyalty
- ROI: Analysis of “Bring 4 Pay for 3,” percentage discounts, points/bonus, and gift campaigns.
- Segment impact: Campaign performance across new/active/dormant customer groups.
6) Staff & Productivity
- KPIs: Transactions, return rate, target adherence, cashier collection performance.
- Shift/timekeeping link: Overtime vs. output reviewed together.
7) Customer & CRM
- LTV: Visit frequency, service mix, preferred communication channels.
- Call/message integration: Call logs via IP PBX/Caller ID; impact of SMS/WhatsApp notifications.
Filters, Segments & Pivot: Slice Data Any Way You Want
Reports can be narrowed with date range, branch, user, service type, campaign, payment type, and more. Save and reuse segments (e.g., “no visit in last 90 days,” “gold members,” “package users”). With pivot support, swap rows/columns to view the same data from different angles. For example, put branches in rows, months in columns, and revenue as the value to catch regional trends at a glance.
Charts & Dashboards
- Time series: Day/week/month breakdowns; prior-period comparison and moving averages.
- Distribution charts: Payment types, service mix, campaign participation rates.
- Target vs. actual cards: Branch targets, person/station goals, and alert colors.
- Live dashboards: In-day order flow, delayed items, and pending pay-on-delivery.
Alerts & Thresholds
Define threshold-based alerts for critical metrics. Examples:
- Notify managers when “Ready-but-delayed orders > 10.”
- Create a task for the quality team if “Return rate exceeds %X.”
- Suggest campaign acceleration if “Daily revenue < 80% of target.”
- Open extra lines/callback queue if “Call wait time > 90s.”
Excel/PDF Export: Share, Audit, Archive
- One-click download: Export the report you’re viewing to Excel or PDF with all applied filters.
- Column selection: Remove unneeded fields to keep outputs concise.
- Page setup (PDF): A4/A3 size, portrait/landscape, margins, auto page numbers, and date stamps.
- Branding: Add header/footer, logo, title, and report notes; confidentiality tags (e.g., “Internal Use”).
- Charts: High-resolution charts in PDF; tables + data in Excel.
- Locale formats: Dates/currencies follow local settings; full UTF-8 character support.
Industry Examples
Dry Cleaning & Tailoring
Use the “error reason” report to reduce return rates in per-item services. Adjust shifts based on intraday peak hours to shorten wait times. During campaigns, track how the shirt/ironing package affects basket size; if ROI is low, tweak the rules.
Carpet Washing
Track m2-based prices and add-on revenues (stain/special care) separately. Optimize vehicle/courier capacity with slot occupancy reports; if cancellation/no-show rises, increase reminder frequency. Use regional demand heatmaps for branch planning.
Shoe Care
See how “add-on services” grow the basket in quick-service flows. Apply incentives to stations that reduce processing times during peak hours. Feed back return reasons on dye/repair items to the quality team.
Car Wash
Monitor renewal rates for packages; reduce churn with “upcoming expiry” alerts on memberships. Plan staffing for weekends/seasonal peaks and track wait times live on dashboards.
Multi-Branch & Channel Unification
Headquarters sees all branches’ sales, cancellations/returns, and collection breakdowns in a single chart. In-store, phone, and online channels are unified; POS/cash register and online payment records are reconciled with e-document flows. Different price/slot/campaign rules appear as “tags” in reports to ensure fair comparisons.
Data Accuracy, Access & Security
- Authorization: Report visibility is role-based; sensitive financial reports are restricted to authorized users.
- Traceability: Report creation/download actions are logged to preserve the audit trail.
- Standard codes: Shared dictionaries for return/cancel and error reasons ensure comparability.
Setup & Best Practices
- Define goals: Set branch/team targets and critical KPIs (SLA, returns, revenue, basket).
- Keep the report set lean: Prioritize decision-driving dashboards over sheer volume.
- Filter favorites: Save frequently used segments and share them with the team.
- Alert thresholds: Pre-define rules for delays, returns, and falling revenue.
- Excel/PDF standards: Standardize output templates (logo, header, date/time) and page layout.
- Training & discipline: Requiring fields like “notes” and “reason codes” determines report quality.
FAQ
Are reports real-time?
Operational reports update instantly; some consolidated dashboards refresh within minutes.
Do visuals break in Excel/PDF?
PDFs render charts in high resolution; Excel exports preserve tables + data.
Can I use my own template?
Yes. Define PDF/Excel templates with logo, title, headers/footers, and page numbers.
How do I compare multiple branches?
Put branch on rows, date on columns, and revenue/volume in values—use pivot to compare.
Can I see POS and online payments in one report?
Yes. Cash register/POS and PayTR/iyzico payments are consolidated and reconciled with e-document flows.